MeterWorks Spectrum Analyzer — see the hum, click or high-frequency whine in your house and narrow down where it comes from
in preparation · no app store link yet
Something in the flat hums, buzzes or whines, and you cannot pin it to a device or to a room. MeterWorks Spectrum Analyzer makes exactly those tones visible — from a low hum to a high-frequency whine at the top of your hearing range. It measures through the device microphone, shows the spectrum live, logs by itself whenever a marked frequency band stands out, helps you narrow down the source with an A/B comparison and a walk-around, and exports the result as a PDF. The app is finished and tested on a real iPhone, but it is not published on the App Store yet: the store listing, the purchase link and submission are still missing. This page describes what the app does — not what you can buy today.
Where is that noise coming from? Narrowing down the source
The most common reason to reach for a sound app is mundane and still stubborn: a strange noise in the house that nobody can place. A buzz that gets more obvious at night. A click every few minutes. A whine that stops the moment you walk into the room. Plenty of things could be behind it — a heat pump, a transformer or power supply, a fan, a charger, an old appliance on standby, a water pipe. You rarely hear which one it is.
The app splits that question into three smaller ones. What is it? The live spectrum shows which frequency the noise sits at; mains hum at 50 Hz looks nothing like a switching power supply far higher up. When does it happen? The band watcher keeps an eye on the marked band and builds the event list itself, with time, duration and level above the background — over a whole night if you want. Which device is it? That is what the A/B comparison is for. And the direction? That is the walk-around. Both are described further down.
If you searched for an app that finds the source, this is the honest version of that: the app narrows a source down by comparison, it does not locate it. Nothing is triangulated, no position is calculated — you simply see at which point along your route more level arrived in the band you are watching. That rules out corners and tightens the search area. Finding the thing itself is still your job.
One example: the case no app covered
A German Mac forum documents the case that started this app. Someone hears a high frequency tone at home — a whine, a piercing whistle. The children hear it clearly; the adults in the household barely or not at all. The suspicion: a motion detector that emits a tone, or an ultrasonic cat or marten repeller somewhere nearby. What they wanted was an app that logs when the tone occurs. The community's answer: no such app exists — record 24 hours of raw audio and search through it by hand afterwards.
That is exactly what this app is built for. You mark the frequency band the tone sits in, leave the measurement running, and the app builds the event list itself: when the tone started, how long it lasted, how far above the background it was.
The uncomfortable half comes with it, immediately. The built-in microphone samples at 48 kHz, so the measurable range ends at 24 kHz. Real ultrasound above that is invisible to every iPhone — including to any app that claims otherwise. The motion-detector case still works: "the children hear it, the adults don't" means, by definition, audible — so below roughly 20 kHz, which sits well inside the measurable window. The reverse is just as true: a watcher that finds nothing is not proof that nothing is being emitted. The app says so at the moment you create a band at 20 kHz or above.
Live spectrum, quiet references and a self-test
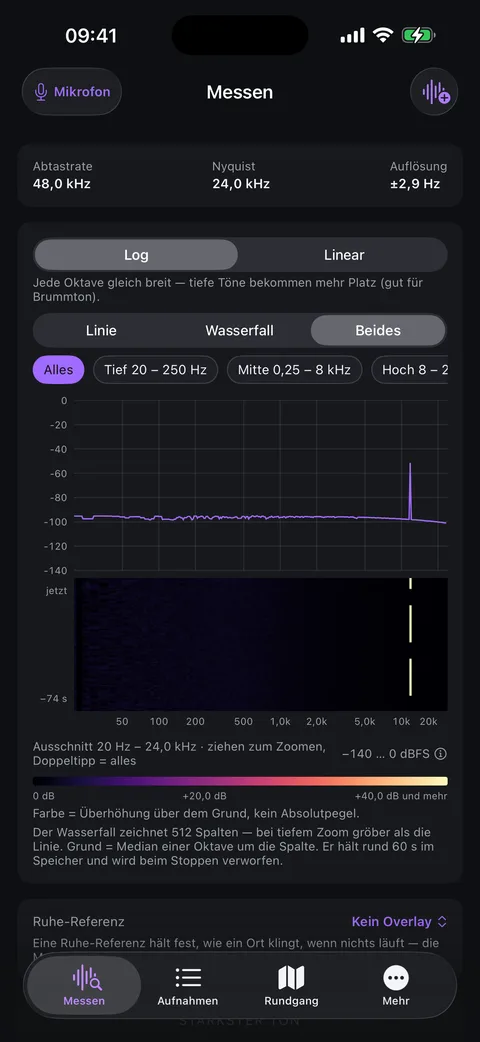
The live spectrum runs on a linear or logarithmic scale, as a line, as a waterfall, or both at once. Zoom presets for low, mid and high jump to the range in question — hum at the bottom, whine at the top. The strongest peak is shown as a number, always together with the resolution it was determined at: a peak is never drawn finer than the measurement actually knows it.
Quiet references capture the band-by-band background of a place — "kitchen at night", "garden" — and lay it over the live measurement as an overlay. You then see not only how loud a band is right now, but how far above normal for that place it sits.
The self-test "what can your iPhone do?" answers the question that comes before all others: does this device see the range in question at all? It shows the active microphone mode, the sample rate, the highest band that still returns an answer, and a band grid with the margin above the median noise floor for each band.
Band watcher, A/B comparison and a walk-around
The band watcher is the core. You mark one or more frequency bands — there are presets for a high tone and for a hum, and free bands work too — and the app reports every event in that band by itself, with start time, duration and level above the background. Before the first event, the watcher learns the background; no events can occur during that warm-up, so switching on never lands in the log as an incident. Detection profiles set how quickly it reacts: fast for short beeps, slow for hums, which only count as such above a minimum duration and whose short gaps are bridged.
Every event is classified: continuous tone, sporadic, or level-stable. That is the information that matters in a conversation — a device that kicks in for a few seconds every few minutes looks different from a transformer that simply runs.
For "which device is it?" there is the A/B comparison: one snapshot with the suspected device switched on, one with it off. The difference shows which part of the spectrum belonged to the device. The app does not guess; it shows the difference.
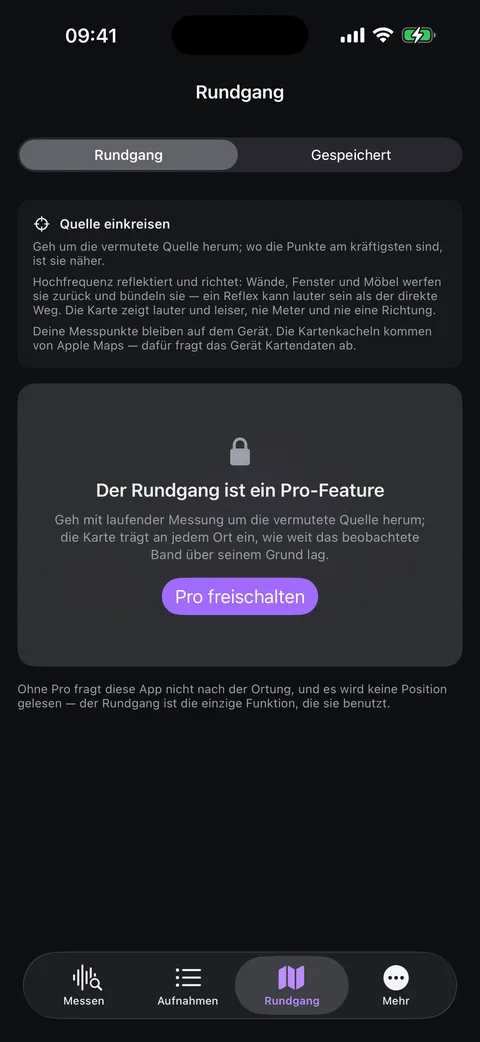
The walk-around takes on the direction question: keep the measurement running and walk around the suspected source. The app drops numbered points on a map and records where the observed band was louder, with confirmed continuous tones marked separately. That lets you close in on a source — a level comparison along a path, not direction finding.
At the end there is the log PDF: period, device, sample rate, resolution, event table, band level history, plus a paragraph on method and limits. The CSV export comes in three parts — peak table, band level time series, and a decimated spectrogram matrix. The walk-around gets its own report with a map extract; exact coordinates are only included if you switch them on explicitly, and they are off by default.
Honest about its limits
The 24 kHz wall is not a weakness of this app, it is physics: a 48 kHz sample rate means a 24 kHz ceiling, and above it there is nothing — not weak, simply not present. An external microphone with a higher sample rate is used if present, but it is untested here and explicitly not a reason to buy. Bluetooth headsets are rejected: their voice link ends at around 8 kHz and would cut away precisely the range this app is about.
An absolute dB value means little without calibration; an uncalibrated phone microphone deviates noticeably at high frequencies. What holds up is the comparison within the same band over time — "+31 dB above the background" — not the absolute number, and not a comparison between two different bands.
Very little is stored, on purpose: 82 bands on a 1/8-octave grid, as maxima every 0.25 seconds, plus the peak track. Never raw audio, never the fine-resolution spectrum — speech can be reconstructed from that, and then "no audio data" would be a lie. Everything stays on the device: no account, no cloud, no transmission.
And the sentence above all others: this app documents, it does not judge. Not a calibrated measurement, nothing court-admissible — a clean log with its method and its limits stated openly.
Who it's for
For anyone with an unidentified noise in the house who wants to know what it is, when it happens and roughly where it comes from — the hum in the bedroom, the click in the utility room, the buzz that only bothers you at night. For people who hear a high-pitched tone or whine that others in the household cannot hear, and want to prove it first: when it occurs, how long it lasts, and in which part of the flat more of it arrives. For a suspected ultrasonic cat or marten repeller next door that you want to document before raising it. For low-frequency hum from plant rooms, transformers or heat pumps. And for anyone who simply wants a solid audio spectrum analyzer with a spectrogram waterfall on their iPhone.
Key features at a glance
- Live spectrum on a linear or logarithmic scale, as a line, waterfall or both
- Peak readout with frequency and the resolution it was determined at
- Quiet references per location, laid over the live measurement as an overlay
- Self-test "what can your iPhone do?": microphone mode, sample rate, highest responding band
- Band watcher with high-tone and hum presets, automatic events, fast/slow detection profiles
- Events classified as continuous tone, sporadic or level-stable
- A/B comparison of device on versus off, GPS walk-around to close in on a source
- Log PDF and three-part CSV export, no audio data, everything on the device
MeterWorks Spectrum Analyzer is not a calibrated measuring instrument and must not be used for safety-critical, occupational-safety, or court-evidentiary purposes. It documents; it does not certify. The app is built and tested on a real device, but it is not yet available on the App Store — so there is no price to quote yet either. Digitalbucht is the sole proprietorship of Emil Deak, based in Wülfrath, Germany. No team, no agency, no middle layer.
Data and privacy
The app uses the microphone, and for the walk-around your location — only while a measurement is running, never in the background. Only band-aggregated level values and the peak track are stored; audio recordings never are. Everything is processed and kept locally on the device, and exporting or sharing only happens on your own action. No adverts, no tracking, no account. Full terms of use and privacy policy for all apps: Apps: terms & privacy.
More: MeterWorks Sound Meter, MeterWorks Vibrometer and MeterWorks Teslameter — the three measurement apps already released. Or: all apps.
Last updated: August 2026
Describe the idea. We will scope it.
Two sentences are enough: what's stuck, which systems are involved, when it needs to be ready. Reply usually within one working day.